29.神经网络简单实现
import numpy as np
import matplotlib.pyplot as pltw,b = 1.8,2.5np.random.seed(666)
x = np.random.rand(100)*4-2 # x in [-2, 2]
noise = np.random.randn(100) / 3
y = w * x + b + noise
x.shape, y.shape运行结果
((100,), (100,))
plt.scatter(x, y)
plt.show()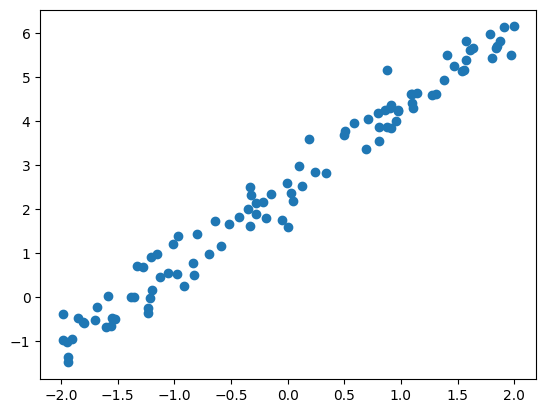
## sklearn
from sklearn.neural_network import MLPRegressor
reg = MLPRegressor(
    hidden_layer_sizes=(1,),
    activation='identity', # 激活函数
    learning_rate_init=0.01,
    random_state=666
)
reg.fit(x.reshape(-1,1),y)
运行结果
MLPRegressor(activation='identity', hidden_layer_sizes=(1,), learning_rate_init=0.01, random_state=666)
reg.score(x.reshape(-1,1),y)运行结果
0.9750745628418249
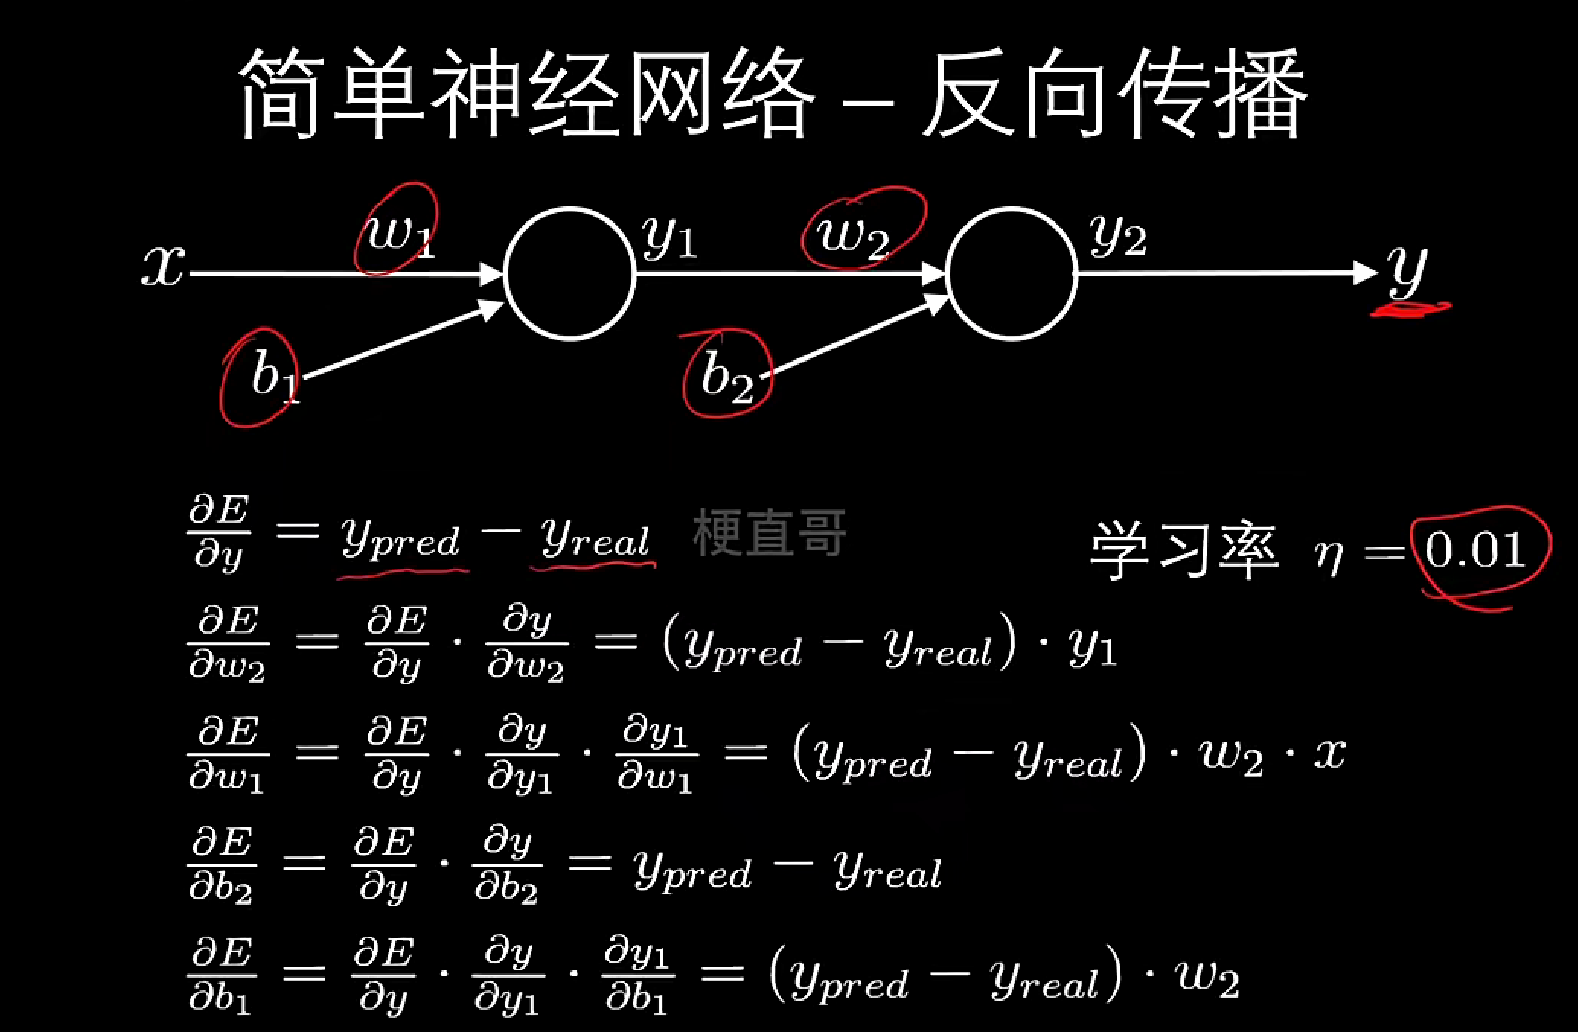
手动实现反向传播
w1,b1,w2,b2 = np.random.randn(4)
w1,b1,w2,b2
运行结果
(0.7250007380708522, -0.006845807351449475, -0.24784023587390022, -1.6879457833888185)
y_real = y.reshape(-1,1)
lr = 0.01x=x.reshape(-1,1)
# y_real.shape
y_real = y_real.reshape(-1,1)
x.shape, y_real.shape运行结果
((100, 1), (100, 1))
for i in range(10000):
    y1 = w1 * x + b1
    y_pred = w2 * y1 + b2
    loss = ((y_real - y_pred) ** 2) / 2

    dy = y_pred - y_real
    dy1 = dy * w2

    dw1 = np.mean(x * dy1)
    dw2 = np.mean(y1 * dy)
    db1 = np.mean(dy1)
    db2 = np.mean(dy)

    w1 -= lr * dw1
    w2 -= lr * dw2
    b1 -= lr * db1
    b2 -= lr * db2

print(w1, b1, w2, b2)
运行结果
1.423115173072882 0.1677858770365035 1.4102137842680067 0.7426167399188073
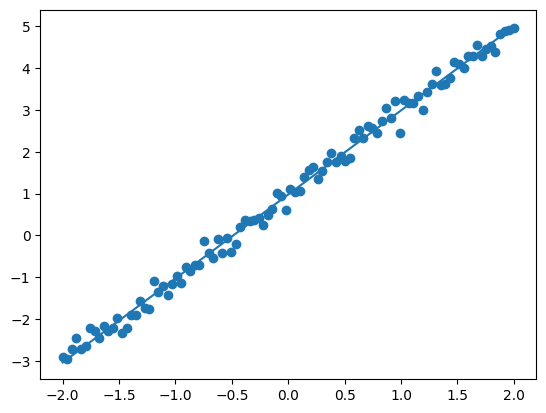
y_p = w2 * (w1*x+b1)+b2y_p运行结果
array([[-3.03456257], [-2.95347584], [-2.87238911], [-2.79130237], [-2.71021564], [-2.62912891], [-2.54804217], [-2.46695544], [-2.38586871], [-2.30478198], [-2.22369524], [-2.14260851], [-2.06152178], [-1.98043505], [-1.89934831], [-1.81826158], [-1.73717485], [-1.65608812], [-1.57500138], [-1.49391465], [-1.41282792], [-1.33174118], [-1.25065445], [-1.16956772], [-1.08848099], [-1.00739425], [-0.92630752], [-0.84522079], [-0.76413406], [-0.68304732], [-0.60196059], [-0.52087386], [-0.43978713], [-0.35870039], [-0.27761366], [-0.19652693], [-0.11544019], [-0.03435346], [ 0.04673327], [ 0.12782 ], [ 0.20890674], [ 0.28999347], [ 0.3710802 ], [ 0.45216693], [ 0.53325367], [ 0.6143404 ], [ 0.69542713], [ 0.77651386], [ 0.8576006 ], [ 0.93868733], [ 1.01977406], [ 1.1008608 ], [ 1.18194753], [ 1.26303426], [ 1.34412099], [ 1.42520773], [ 1.50629446], [ 1.58738119], [ 1.66846792], [ 1.74955466], [ 1.83064139], [ 1.91172812], [ 1.99281485], [ 2.07390159], [ 2.15498832], [ 2.23607505], [ 2.31716179], [ 2.39824852], [ 2.47933525], [ 2.56042198], [ 2.64150872], [ 2.72259545], [ 2.80368218], [ 2.88476891], [ 2.96585565], [ 3.04694238], [ 3.12802911], [ 3.20911585], [ 3.29020258], [ 3.37128931], [ 3.45237604], [ 3.53346278], [ 3.61454951], [ 3.69563624], [ 3.77672297], [ 3.85780971], [ 3.93889644], [ 4.01998317], [ 4.1010699 ], [ 4.18215664], [ 4.26324337], [ 4.3443301 ], [ 4.42541684], [ 4.50650357], [ 4.5875903 ], [ 4.66867703], [ 4.74976377], [ 4.8308505 ], [ 4.91193723], [ 4.99302396]])
plt.plot(x,y_pred)
plt.scatter(x,y_real)
plt.show()